Implementation of AGN model templates into the CIGALE Spectral Energy Distribution fitting code. Applying CIGALE to the observed multi-wavelength photometry of AGN provides constraints to both the properties of the active black hole (e.g. accretion luminosity) and the characteristics of the underlying host galaxy (e.g. stellar mass, star-formation rate).
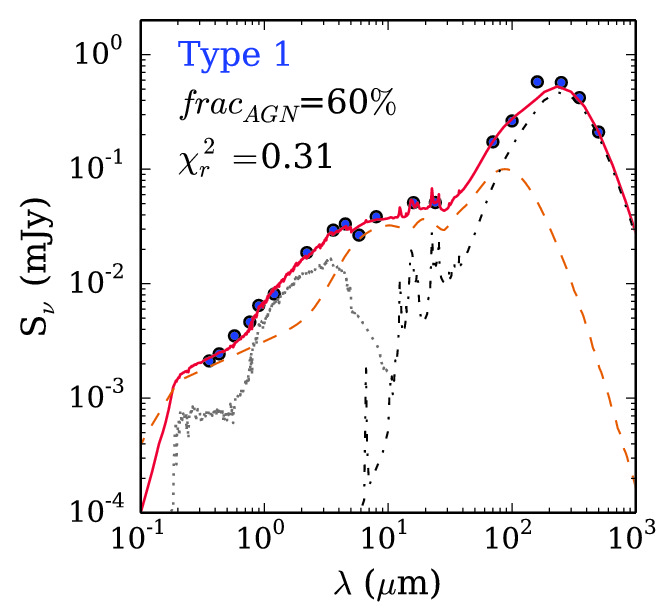
Simulations are used to produce mock Spectral Energy
Distributions of galaxies with realistic star-formation
histories and with variable levels of superimposed AGN
emission. The plots on the left show the examples of two
such simulations. The broad-band photometric data points
are for galaxies hosting unobscured (type 1) AGN with
accretion luminosities that represent 20% (top panel) and
60% (middle panel) of the total infrared luminosity. The CIGALE is then used to fit the mock
SEDs with model AGN+galaxy templates (curves on the plots)
by taking into account dust extinction and redistribution
of the absorbed radiation in the infrared part of the
spectrum.
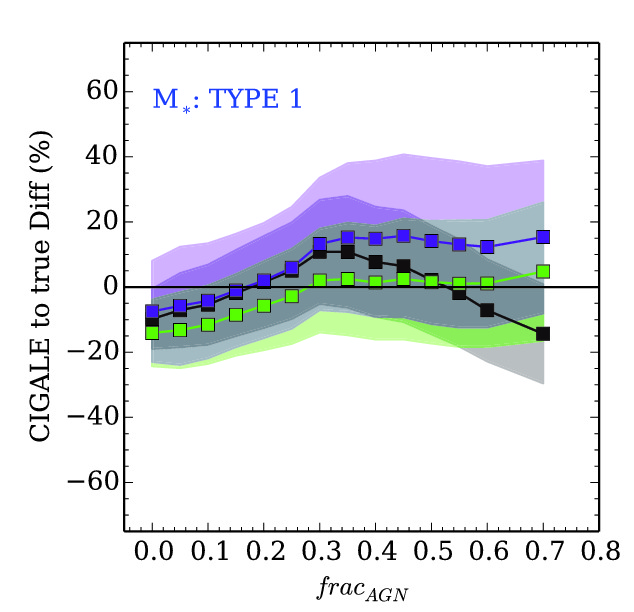
These simulation can test how well AGN and galaxy properties can be constrained via template fits to broad-band multi-wavelength observations. The bottom figure shows that the stellar mass of AGN hosts can be robustly determined. It plots the relative accuracy of the stellar mass determination as a function of the fraction of AGN light relative to the galaxy. The different curves correspond to different parametrisations of the star-formation history of the galaxy. Stellar mass can be determined at better than the 40% level from the observed Spectral Energy Distribution. More details in Ciesla et al. (2015).