
Enhanced XMM-Newton Spectral-fit Database
3XMM photo-z catalogue (XMMPZCAT)
Contents
- Identification of counterparts
- Photo-z with machine learning algorithms
- Description of the catalogue
1. Identification of counterparts
Since optical photometry is needed to derive photometric redshifts, we have to identify the corresponding optical counterparts for the X-ray sources in the 3XMM. The addition of near- and mid-infrared data increase the accuracy of the photometric redshift, so we also look for counterparts in these wavelengths. We looked for optical counterparts using two large area surveys: SDSS and Pan-STARRS. For the SDSS, we used the multi-wavelenghts catalogues from the ARCHES project (Sect.1.1). For Pan-STARRS, we did our own cross-matching of 3XMM and Pan-STARRS (Sect.1.2)
1.1. 3XMMe/SDSS (ARCHES)
The base X-ray catalogue used by ARCHES was the 3XMMe (the enhanced 3XMM catalogue). The 3XMMe catalogue is a reduced version of the 3XMM catalogue but composed of X-ray sources from XMM-Newton observations with the highest quality. This catalogue was cross-matched with several catalogues in different energy ranges: GALEX-DR5, UCAC4, SDSS-DR10, 2MASS, UKIDSS-LAS, AllWISE, SUMMS NVSS and AKARI-FIS. The result consist in two catalogues, one with all-sky covering and including 2MASS, and the other including UKIDSS and with covering restricted to the sky area of this survey. The cross-matching tool used in ARCHES (xmatch) computes probabilities of association for all possible sets of candidates in the cross-matched catalogues.
We were interested in finding counterparts in the optical (SDSS), plus near-infrared (2MASS or UKIDSS) and/or mid-infrared (WISE). Therefore, we rejected all sources with no counterparts in at least one of these catalogues. Moreover, we only kept counterparts with photometry in all the corresponding filters of each catalogue. Probabilities of these associations (optical, optical+NIR, optical+MIR, and optical+NIR+MIR) was derived in each case as a function of the ones provided in the ARCHES catalogues.
We did then a second filtering based on the probabilities of association. We selected sources with probabilities of association >68%. The same X-ray source can appear multiple times in the ARCHES catalogue, associated with a different set of optical, NIR, and/or MIR counterparts. In those cases we kept the association with the largest number of counterparts. If the number of counterparts was the same, we preferred the association having MIR data. If both associations (or none) had MIR data, we just kept the one with the highest probability.
Applying this method, we finally obtained a multi-wavelength catalogue composed of 42,705 X-ray sources with SDSS counterparts, 14,805 of them with near-infrared counterparts (UKIDSS or 2MASS), and 26,926 of them with WISE counterparts.
1.2. 3XMM/Pan-STARRS (XPS)
We did our own cross-matching of Pan-STARRS DR1 (PS1) and 3XMM-DR6 catalogues. Since we are interested in obtaining photometry in the NIR and MIR bands, we also included AllWISE, 2MASS, UKIDSS and VISTA-VHS surveys in the cross-match. We used the xmatch tool for this multi-catalogue cross-matching
For this cross-match we selected sources included in the Pan-STARRS footprint (dec > -30 deg) and within 3XMM fields (we rejected fields flagged as OBS_CLASS> 3, i.e. more than 10% of the area of the observed field is identified as bad, and those within the Galactic plane, |b| ≤ 20 deg).
For consistency with the ARCHES data set, we followed the same selection criteria to build our final catalogue (see previous section). The only difference is that we did not marginalize the probabilities of association, because our cross-match did not contain catalogues we were not interested in. Therefore, the xmatch output directly gave us the proper probabilities.
Our final 3XMM/Pan-STARRS catalogue (XPS) is composed of 88,088 X-ray sources with PS1 counterparts, 21,174 of them with NIR counterparts, and 54,947 of them with MIR counterparts.
2. Photo-z with machine learning algorithms
The photometric redshifts of XMMPZCAT were estimated using MLZ-TPZ (Carrasco Kind & Brunner, 2013), a machine learning algorithm based on a supervised technique with prediction trees and random forest. This is a parallellizable python software that calculates fast and robust photometric redshifts and their corresponding probability density distributions (PDF).
2.1. Training sample
One of the key aspects of estimating photometric redshifts using supervised machine learning methods is the selection of an adequate training sample. This sample should be representative of the global sample for which photo-z will be calculated. In our case we need two training samples, one for the ARCHES catalogue and one for our XPS catalogue.
We used the training sample presented in Mountrichas et al. (2017) for the sources in the ARCHES catalogue. It contains X-ray detected sources with spectroscopic redshifts and SDSS photometric data (plus 2MASS, UKIDSS and/or AllWISE data for some of them). We selected sources from XXL, XWAS, COSMOS, XMS and XBS, all of them X-rays surveys with a high level of spectroscopic identification. In addition, we included 1500 sources spectroscopically identified as QSO in the SDSS-DR13 with X-ray counterparts. Our final training sample is composed of 5157 objects with SDSS photometric data, 3129 with also near-infrared data (UKIDSS or 2MASS) and 4718 with with mid-infrared data (AllWISE).
This sample was also our starting point for building a training sample for our XPS catalogue. We did a positional cross-match between the SDSS training sample and PS1. We selected matches with an angular separation < 0.3 arcsec and with good photometry in all filters (g, r, i, z, y). The resulting sample contains 4773 objects with spectroscopic redshifts and PS1 photometry. 2981 of them have also NIR data, and 4396 have MIR data.
Figure 1 presents the r magnitude, g-r, J-H and W1-W2 colour distributions of the training samples and the ARCHES and XPS full catalogues. Although our training samples are about one magnitude brighter than the application samples, their colour distributions are reasonably well reproduced.
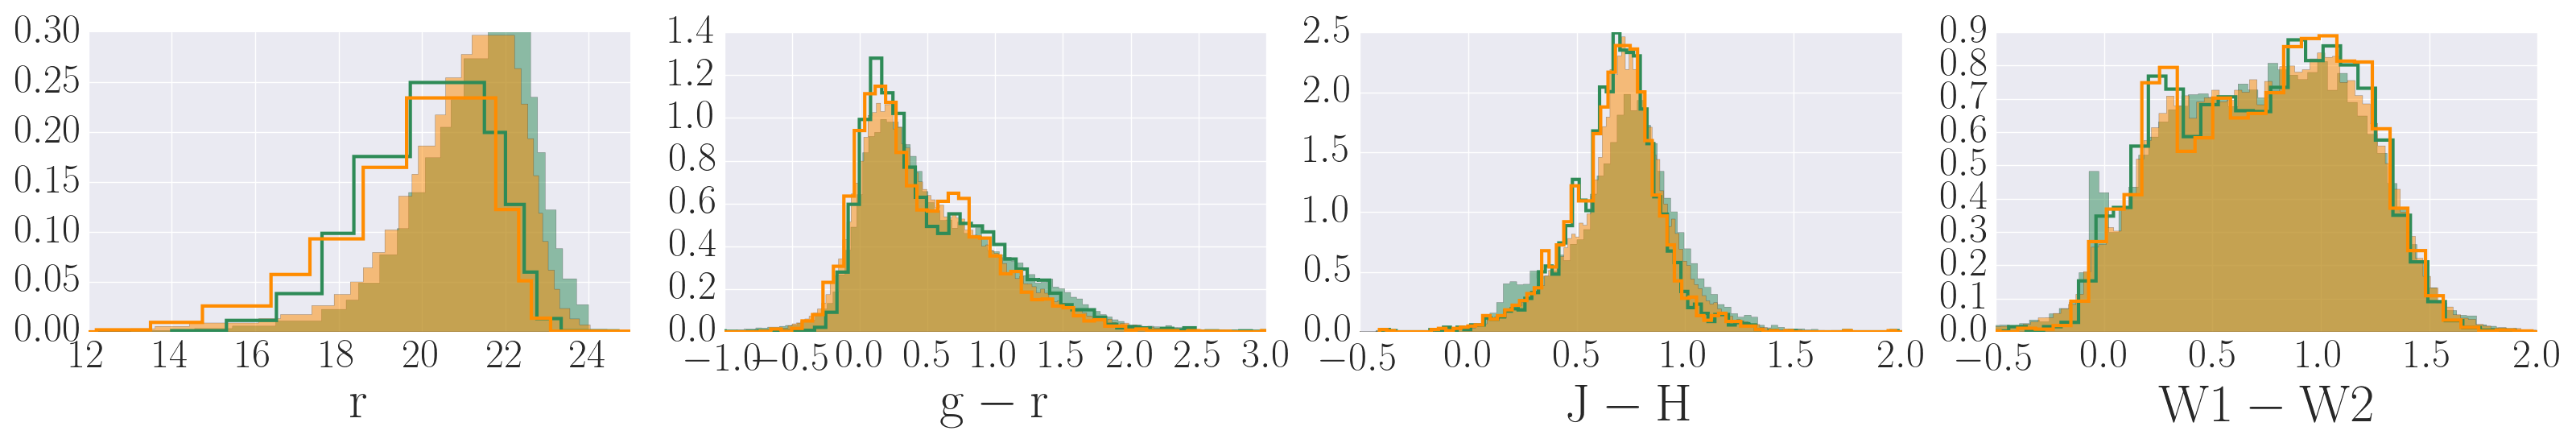 Figure 1. Normalized distributions of r magnitude and g-r, J-H and W1-W2 colours for our training samples (SDSS/Pan-STARRS, open histograms) and the corresponding application samples (ARCHES/XPS, solid histograms). ARCHES/SDSS samples are plotted in green, XPS/Pan-STARRS samples in yellow.
2.2. Quality of photo-zs
One of the main problems of photometric redshifts is estimating their accuracy and reliability. In the case of machine learning techniques, we can obtain a fine estimate of the method's performance, in the statistical sense, through tests using the corresponding training sample.
In order to evaluate the accuracy of our photo-z derivation, we make use of the most widely used statistical indicators, which are the following:
- x = Δ(znorm) = (zspec − zphot) / (1 + zspec),
- σNMAD = 1.4826 × Median(|x|),
- η = 100 × Noutliers / N,
We built 8 different training+testing sets by dividing our training sample according to the sources extension in the optical, and the amount of photometric data available: only optical (5 filters: ugriz), only optical+NIR (8 filters: ugrizJHK), only optical+MIR (7 filters: ugrizw1w2), and optical+NIR+MIR (10 filters: ugrizJHKw1w2). Figure 2 shows a comparison between spectroscopic and photometric redshifts for SDSS (left) and Pan-STARRS (right) training samples. Our test results are presented in the following table:
| SDSS | Pan-STARRS | |||||||
|---|---|---|---|---|---|---|---|---|
| extended | point-like | extended | point-like | |||||
| # filters | σNMAD | η (%) | σNMAD | η (%) | σNMAD | η (%) | σNMAD | η (%) |
| 5 | 0.071 | 18 | 0.076 | 29 | 0.063 | 13 | 0.138 | 41 |
| 7 | 0.057 | 14 | 0.064 | 19 | 0.038 | 6 | 0.088 | 25 |
| 8 | 0.054 | 12 | 0.057 | 20 | 0.052 | 9 | 0.074 | 26 |
| 10 | 0.046 | 9 | 0.049 | 14 | 0.036 | 4 | 0.062 | 17 |
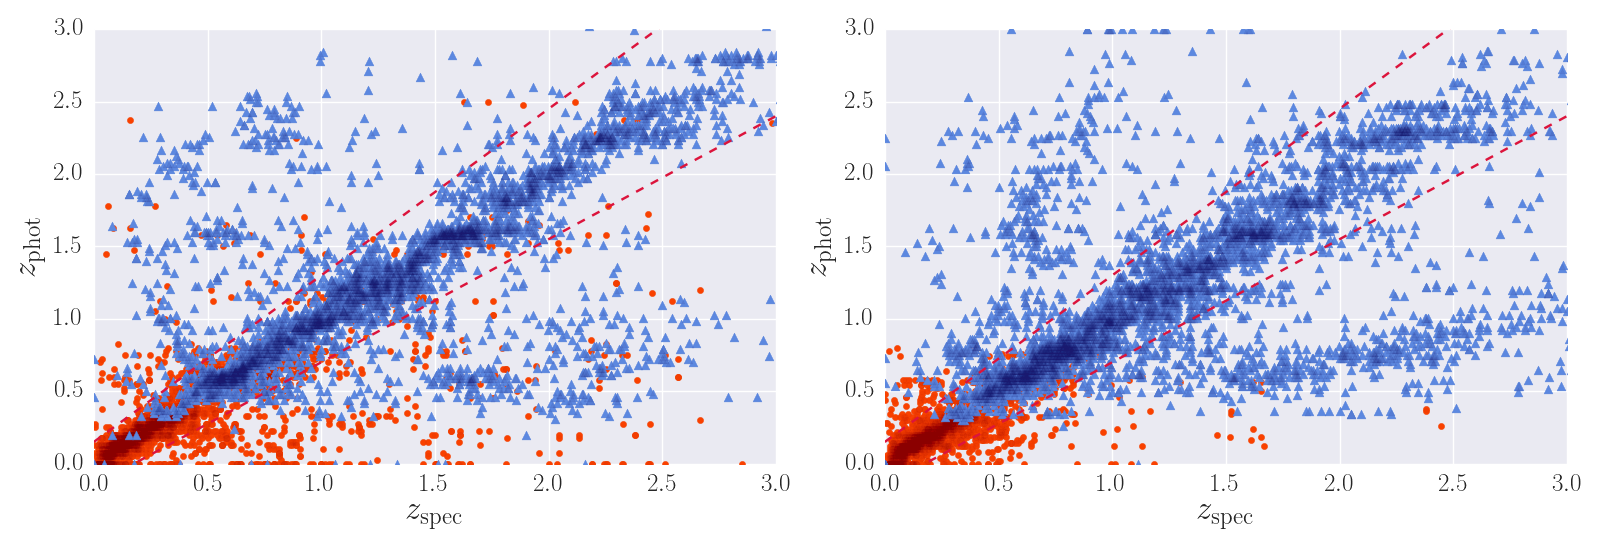 Figure 2. Spectroscopic against photometric redshifts for SDSS (left) and Pan-STARRS (right) training samples. Blue triangles are point-like sources, red circles are extended sources.
Since TPZ gives the full PDF for the photometric redshifts, we can obtain more information on the reliability of the derived redshift for each particular source. An unimodal PDF, narrowly concentrated around its maximum is a sign of a reliable redshift estimate, while a multimodal PDF with several local maxima of similar height is a clear sign that the redshift is badly determined.
We calculated several parameters derived from the PDFs and we tested how a selection of sources based on these parameters affects the performance of our photo-z derivation.
- zConf: The integral of the PDF in the interval ±(1 + zphot) × rms. zphot is the mode of the PDF (the absolute maximum and the chosen value as the photometric redshift of the source) and rms is the intrinsic dispersion of the method, which depends on the employed training sample. For our sample we have used rms=0.06. A high value of zConf means that the PDF is highly concentrated around zphot.
- Npeaks: Number of local maxima (peaks) in the PDF.
- PS (Peak strength): 1 − P2/P1, where P1 is the probability density of the highest local maximum in the PDF, and P2 is the second maximum peak. If the PDF is unimodal (P2=0) or P2 << P1, PS ∼1.
Figure 3 presents the results of our statistical tests using the training+testing samples we described above, for the SDSS and Pan-STARRS samples. For each sample, we selected sources with PS or zConf greater or equal than a given value, and we calculated η, σNMAD, the percentage of rejected sources with respect to the total number of sources in the full training sample (i.e. without any filtering), and the percentage of rejected sources that are not outliers with respect to the number of rejected sources. Note that Npeaks is one if PS is one, therefore a Npeaks-based selection (Npeaks=1) is equivalent to selecting sources with PS=1.
There is an obvious trade-off between selecting high confidence photometric redshifts and the final number of sources in the sample. Finding a compromise between these two factors is therefore necessary. No filtering based on this kind of quality criteria was applied in the final version of XMMPZCAT. We included our estimates of this parameters in the catalogue, and is up to the final user to apply the quality selection best suited for the pursued scientific goals.
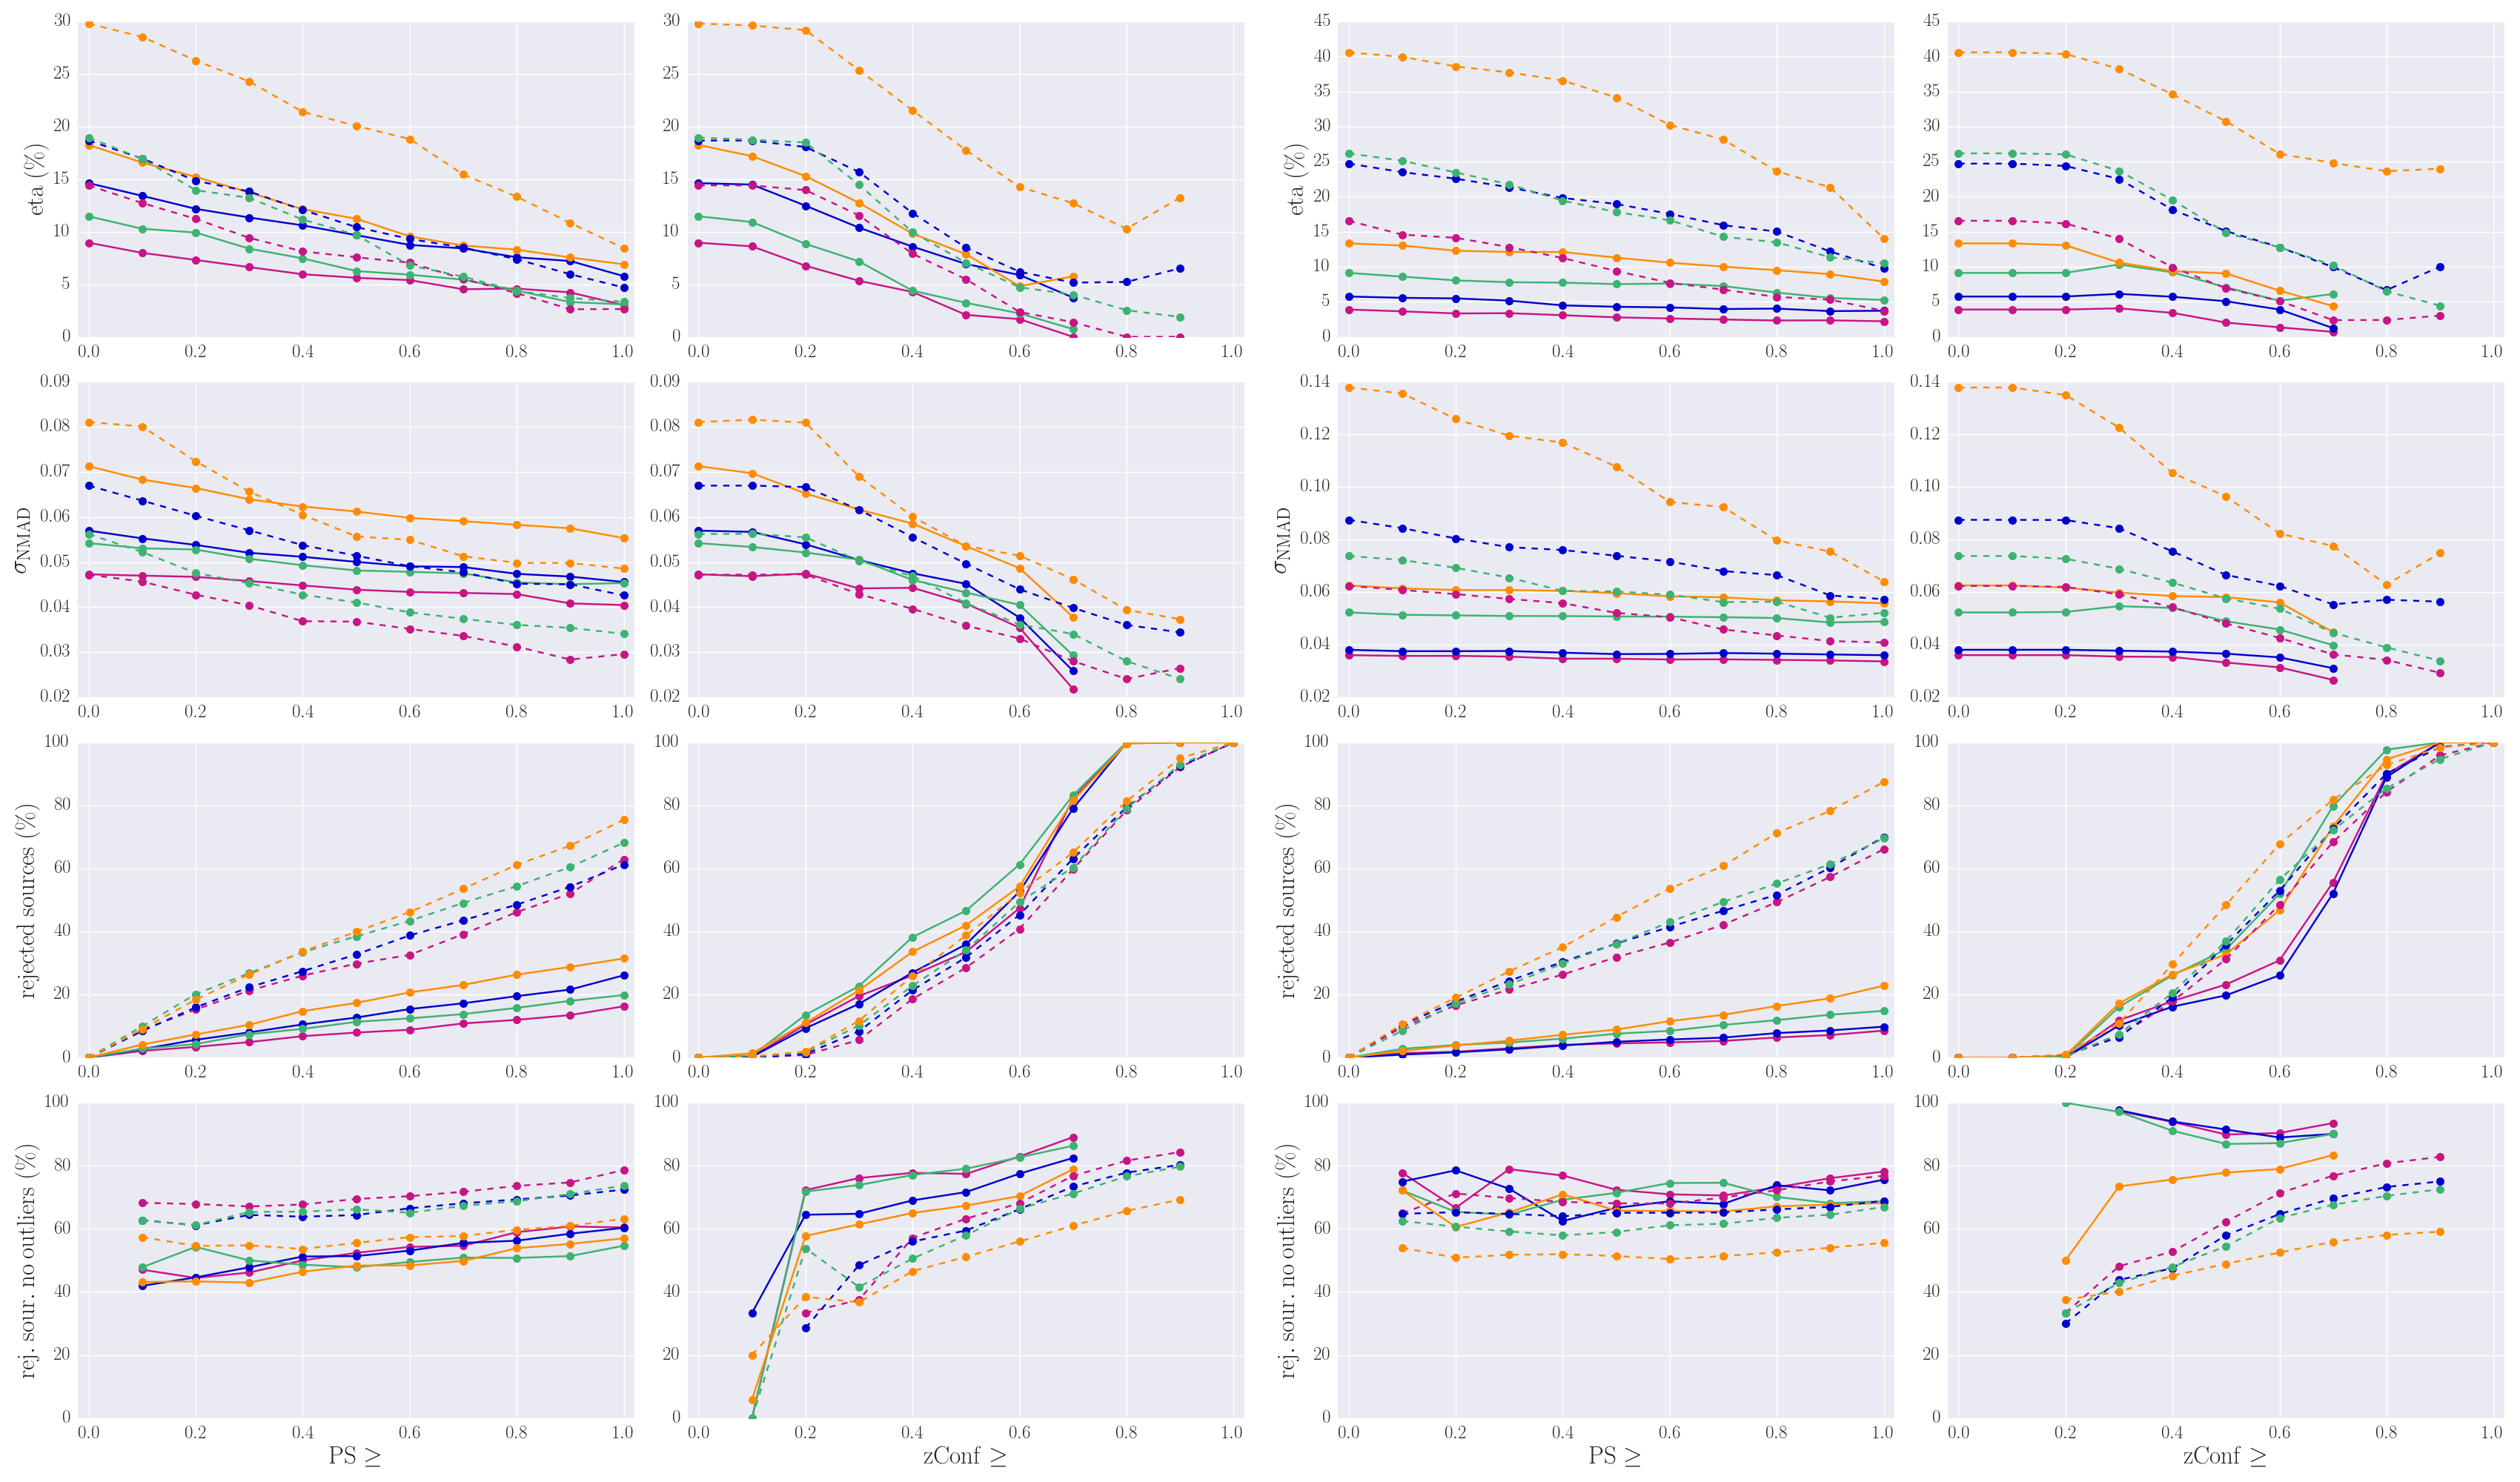 Figure 3. Statistics for the derivation of photometric redshifts, using the training+testing SDSS (left) and Pan-STARSS (right) samples. Left column plots correspond to a selection based on PS, right column plots correspond to a zConf selection. First row: percentage of outliers; second row: normalized median absolute deviation; third row: percentage of rejected sources after filtering; fourth row: percentage of rejected sources that are not outliers. Purple symbols correspond to 10 filters samples, blue symbols to 7 filters samples, green symbols to 8 filters samples, orange symbols to 5 filters samples. Solid lines correspond to extended sources samples, dashed lines to point-like sources samples.
2.3. Separating stars
At the average X-ray flux levels of the 3XMM catalogue and high galactic latitudes, the expected percentage of X-ray emitting stars is small, below 10%, but not negligible. TPZ can be used also to classify sources, and it has in fact been used before to separate optical stars from quasars with an extremely high efficiency by using SDSS and WISE photometry.
Stars are easily separated from galaxies and QSO using a combination of optical and IR colours. We can use objects in our catalogue having IR photometry to identify X-ray emitting stars. With these objects we can build a training sample for TPZ and identify stars for sources with only optical colours available.
In the ARCHES (XPS) sample we have 16,321 (50,614) point-like sources with the needed optical and IR colours. Figure 4 shows two colour-colour plots for XPS point-like objects. For a systematic separation between stars and galaxies/QSO we used the python package hdbscan (Campello et al. 2013, McInnes et al. 2017), a hierarchical, density-based clustering algorithm. Through hdbscan we divided the ARCHES and XPS samples between stars (green triangles) and galaxies/QSO (blue circles). We obtained a training sample of 2816 stars and 10,992 no-stars for the ARCHES sample, and of 5555 stars and 36,004 no-stars for the XPS sample.
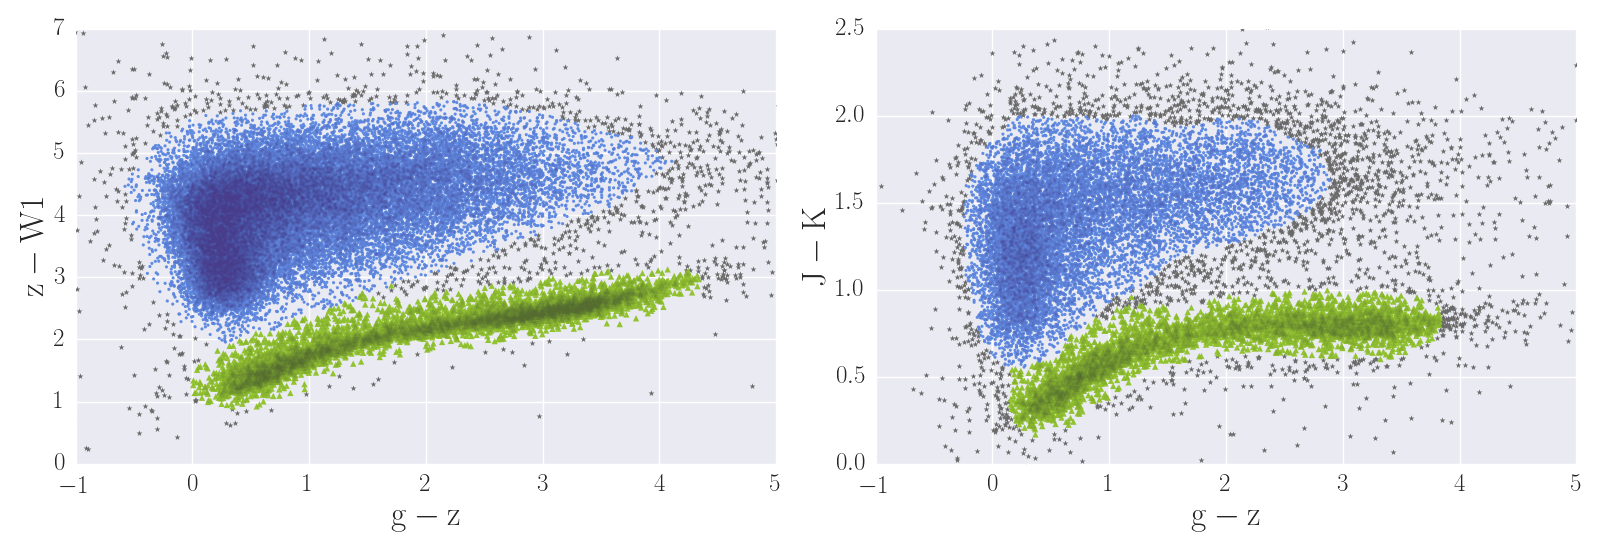 Figure 4. Colour-colour plots of point-like XPS sources showing our separation between stars and no-stars using the hdbscan clustering algorithm. Left: g-z versus z-W1. Right: g-z versus J-K. Green triangles are sources classified as stars; blue circles are sources classified as no stars; gray asterisks show unclassified objects.
Using these training samples in TPZ we can identify stars for those sources with only optical colours available. For the ARCHES (XPS) sample TPZ found 4680 (5636) objects as stars, 2008 (1599) of them not identified through the IR-colour selection. In the final catalogue of 100,178 X-ray sources there are 10,830 stars (∼ 11%), after combining those stars identified through IR colours and those identified using TPZ. Figure 5 shows an optical colour-colour diagram for point-like sources in our sample. The plot clearly shows that our method is able to identify the typical star tail of this kind of diagrams (magenta open circles).
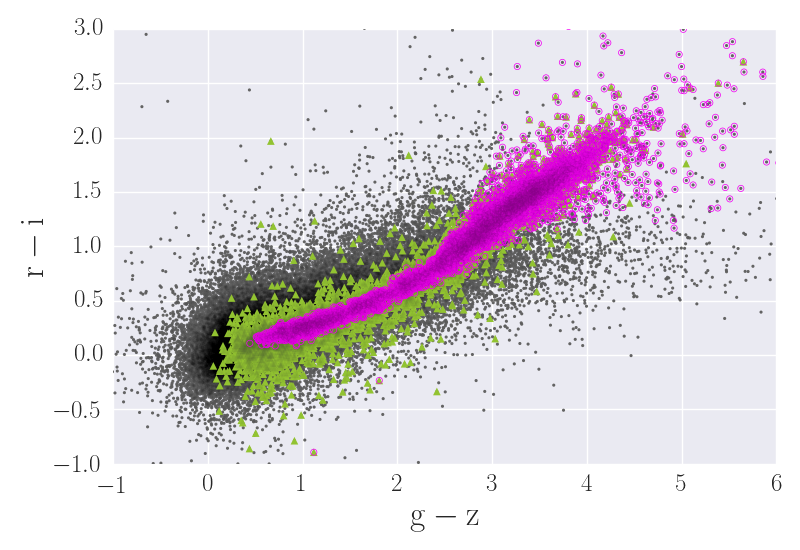 Figure 5. r-i versus g-z colour-colour plot of XPS point-like sources. Magenta open circles are sources identified as stars using TPZ. Green triangles are sources classified as stars using colour criteria. Gray dotss are the remaining point-like objects in the XPS sample.
2.4. Merging ARCHES and XPS photo-z
We found 32,460 X-ray sources with counterparts in both ARCHES and XPS catalogues. In order to build our final catalogue of photometric redshifts, we have to select which photo-z include for these sources. Our merging criterion was as follows: in those cases where the ARCHES photo-z was estimated using the same or more filters than the XPS photo-z, and the SDSS photometry was flagged as clean (see Sect. 3), we selected the ARCHES photo-z; otherwise the XPS photo-z was included in the final catalogue.
3. Description of the catalogue
The photometric redshift catalogue consists of a FITS table with one row for each unique X-ray source, and 17 columns containing the estimated redshift plus additional information about the X-ray source, the optical counterpart and several parameters that can help assessing the reliability of the derived photometric redshift. Not available values are represented by a "null" value.
xmm_SRCID: Source identification label from 3XMM-DR6 catalog.
XMM RA, XMM DEC: X-ray source coordinates as in 3XMM-DR6.
XMMFITCAT: Source included in the XMM-Newton spectral-fit database.
XMATCH: Origin of the optical counterpart, ARCHES (SDSS) or XPS (Pan-STARRS).
proba_XMATCH: Probability that all counterparts are associated to the same real source, as estimated by xmatch.
opt_SRCID: Source identification number in SDSS-DR10.
Nfilters: number of magnitudes used in the photometric redshift estimation (u or y magnitude depending on the origin of the optical counterpart, SDSS or Pan-STARRS, respectively).
- 10: [u]griz[y]JHKW1W2
- 8: [u]griz[y]JHK
- 7: [u]griz[y]W1W2
- 5: [u]griz[y]
extended: True if the source is classified as extended in SDSS-DR10.
ph_flag: quality of the photometric data. XYZ, where X is the flag for optical data, Y for WISE data and Z for NIR data (2MASS or UKIDSS). The possible values for X/Y/Z are:
- A: all magnitudes in this range are flagged as good
- B: some magnitudes in this range have bad photometry
- F: all magnitudes are bad
- 0: no photometric data in this range
inTCS (in Training Colour Space): all colours used to calculate the photometric redshift are inside the colour space covered by the training sample.
STARS: True if the source was identified as a star.
SPEC Z: Spectroscopic redshift in SDSS-DR13.
PHOT_Z: photometric redshift estimated by TPZ.
PHOT_ZERR: one-sigma error of the photometric redshift.
PHOT_ZCONF: confidence of the photometric redshift.
Npeaks: number of local maxima in the PDF.
PS (Peak Strength): 1-P2/P1, where P1 is the probability density of the highest local maximum, and P2 is the second maximum peak.
PHOT_Z2: redshift position of P2.
© Copyright IAASARS/NOA | Courtesy of Open Web Design | A. Ruiz, webmaster